Design of Experiment
DOE
Contents for this Design of Experiment blog
Document and describe how the full factorial data analysis was performed.
Determine the effect of single factors and their ranking
Determine the interaction effects
All tables and graphs both as pictures and as excel file
Conclusion of the data analysis for full factorial data analysis
Documentation of how the fractional data analysis was performed by selecting 4 experiments from the full factorial data that are orthogonal
Determine the effects of single factors and their ranking
All tables and graphs both as pictures and as excel file
Conclusion of the data analysis for fractional data analysis
For this activity,I was tasked with doing Case study 2.
In this case study, in a wastewater treatment facility, a combination of coagulant chemicals, treatment temperature and stirring speed were identified as a critical factor to treat the wastewater to produce clean water. The clean water produced is recycled back into the main process and at the same time reduces the amount of pollutant discharged by the plant.
For this experiment,3 factors were identified:
Concentration of coagulant added,1% and 2% by weight
Treatment temperature,72°F and 100°F
Stirring speed,200 rpm and 400 rpm
8 runs were performed.
Factor A= Concentration of coagulant added
Factor B= Treatment temperature
Factor C=Stirring speed
Place the data in the table above into the template for data analysis

The next step is to calculate the significance of the main effects by find the average of runs where the factor is positive and runs where the factor is negative,
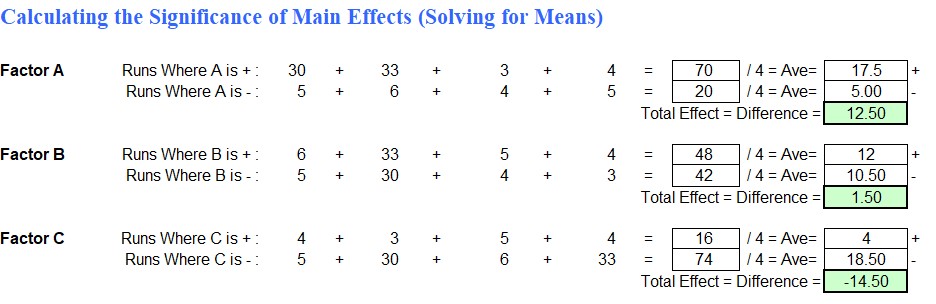
After calculating the values, we would need to plot a graph to find out the effect of the single factors on the mass of clean water produced.
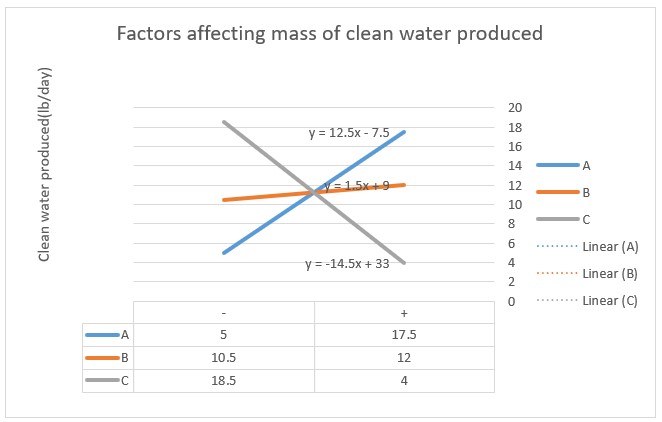
The gradient in this graph represents the effect of the factors that impact the mass of clean water produced.
From the graph above, we can see that Factor C (Stirring Speed) has the most significant impact on the mass of clean water produced as it has the biggest gradient of -14.5 when the stirring speed was changed from 400 rpm to 200 rpm. This suggests that as the stirring speed decreases, the mass of clean water produced decreases.
Factor A (Concentration of coagulant) has the second most significant impact on the mass of clean water produced as it has the second-largest gradient of 12.5 when the concentration of coagulant was increased from 1% by weight to 2% by weight. This suggests that as the concentration of coagulant increases, the mass of clean water produced increases.
Factor B (Treatment temperature) has the least significant impact on the mass of clean water produced as it has the smallest gradient of 1.5 when the treatment temperature increases from 72°F to 100°F. This suggests that as the treatment temperature increases, the mass of clean water produced also increases.
Thus the ranking of the factors that impact the mass of clean water produced is:
Factor C
Factor A
Factor B
Next, we will determine the interaction effects of two different factors.
When two factors are said to interact with each other if the effect of one factor on the response variable is different at different levels of the other factor. Hence we will do data analysis on the interaction effect.
Firstly, we are going to do data analysis for the full factorial design interaction effect of A and B.
A x B:
At Low B,
Average of low A =(5+4)/2 =4.5
At Low B,
Average of high A =(30+3)/2=16.5
At Low B, the total effect of A=12 increase
At High B,
Average of low A=(6+5)/2=5.5
At High B,
Average of high A=(33+4)/2=18.5
At High B, the total effect of A=13 increase
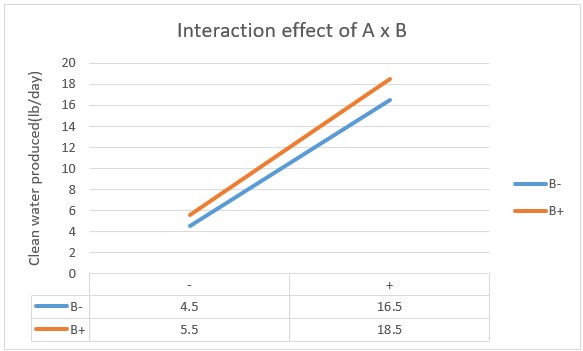
From this graph, the gradient of both lines in the interaction effect of A x B graph is positive and different by a small margin. This suggests that there is an interaction between factors A and B but the interaction is small and thus insignificant.
Next, we are going to do data analysis for the full factorial design interaction effect of A and C.
A x C:
At Low C,
Average of low A=(5+6)/2=5.5
At Low C,
Average of high A=(30+33)/2=31.5
At Low C, the total effect of A=26
At High C,
Average of low A=(4+5)/2=4.5
At High C,
Average of high A=(3+4)/2=3.5
At High C, the total effect of A= 1 decrease

From this graph, the gradient of both lines in the interaction effect of factors A and C are different( one is positive and one is negative). Therefore, there is a significant interaction between factors A and C.
Next, we are going to do data analysis for the full factorial design interaction effect of B and C.
B x C:
At Low C,
Average of low B =(5+30)/2=17.5
At Low C,
Average of high B=(6+33)/2=19.5
At Low C, total effect of B=2 increase
At High C,
Average of low B=(4+3)/2 = 3.5
At High C,
Average of high B=(5+4)/2= 4.5
At High C, total effect of B=1 increase
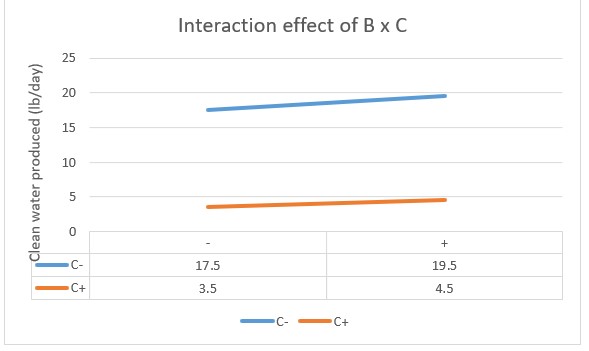
We can see that the gradients of the interaction effect between factors B and C are positive and different by a small margin. Therefore, there is an interaction between factors B and C, but the interaction is small and hence insignificant.
Part 2
Fractional data analysis using 4 experiments from full factorial data.
The runs I have decided to use are Run 1,2,3 and 4.
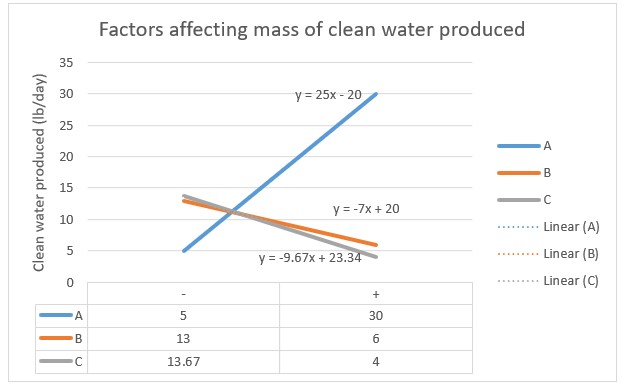
The gradient in this graph represents the effect of the factors that impact the mass of clean water produced.
From the graph above,Factor A (Concentration of coagulant) has the most significant impact on mass of clean water produced as it has the largest gradient of 25 when the concentration of coagulant was increased from 1% to 2%. Hence as the concentration of coagulant increases, the mass of clean water produced increases.
From the graph above, Factor C (Stirring speed) has the second-largest most significant impact on the mass of clean water produced as it has the second-largest gradient of -9.67 when the stirring speed was decreased from 400 rpm to 200 rpm. Hence as the stirring speed decreases, the mass of clean water produced decreases.
From the graph above, Factor B (Treatment temperature) has the least significant impact on the mass of clean water produced as it has the smallest gradient of -7 when the temperature decreases from 100°F to 72°F. Hence as the temperature decreases, the mass of clean water produced decreases.
Thus the ranking of the factors that impact the mass of clean water produced is:
Factor C
Factor A
Factor B


Comments
Post a Comment